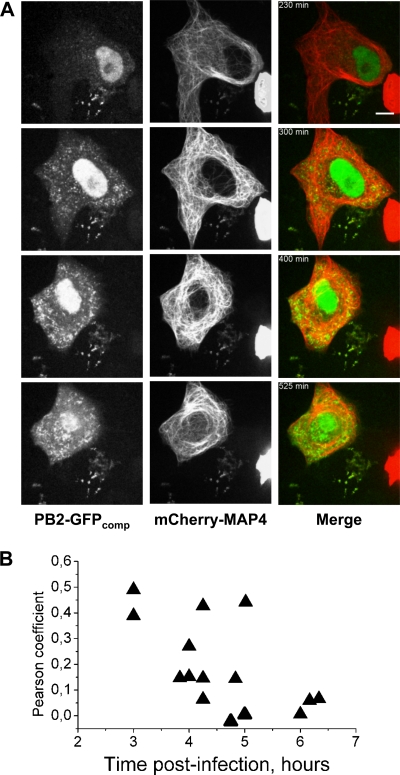
Fig 8.
Time-lapse imaging of live infected cells and colocalization analysis for PB2-GFPcomp and microtubules. (A) A representative Vero cell transiently expressing GFP1-10 and mCherry-MAP4 and infected with the WSN-PB2-GFP11 virus. Selected frames from a time-lapse series (see Movie S2 in the supplemental material) acquired during ∼700 min with 5-min intervals using an Andor Revolution Nipkow disk microscope, as described in Materials and Methods, are shown. In merged images, the PB2-GFPcomp and Cherry-MAP4 signals are pseudo-colored green and red, respectively. Scale bar, 10 μm. (B) Colocalization between PB2-GFPcomp and mCherry-MAP4 in the cytoplasm of infected cells, as characterized by the Pearson coefficient, throughout the course of infection. Each triangle represents the Pearson coefficient measured in an individual cell (data from four independent infections are shown).

