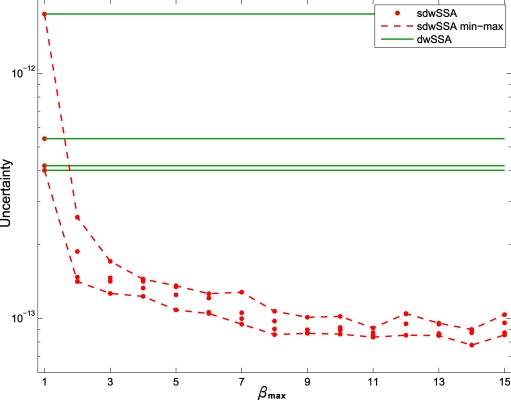
Figure 2.
Uncertainty vs βmax for the yeast polarization model. For each βmax, four independent instances of the CE-DB with were executed, followed by four instances of the core sdwSSA with K = 107. Each red dot corresponds to the uncertainty of sdwSSA estimates, and two red lines connect the minimum and the maximum uncertainties in each βmax value. The four green lines represent dwSSA uncertainties.

