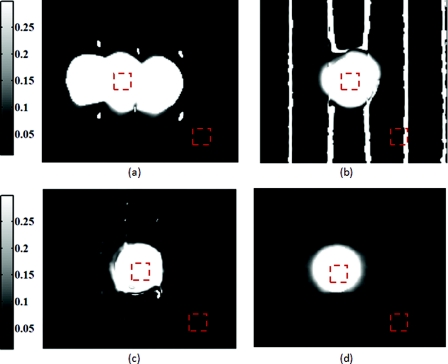
Figure 5.
Comparison of absorption maps at 650 nm for a moving test lesion where: (a) no motion correction is applied, (b) images are reregistered to compensate for motion, but the demodulation calculation still assumes 120 deg phase separation [i.e., Eq. 3] (c) is motion corrected using a consistent ROI and demodulation correction. (d) The absorption map at 650 nm for an ideal stationary test phantom. Dashed squares indicate areas sampled for extracting data.

