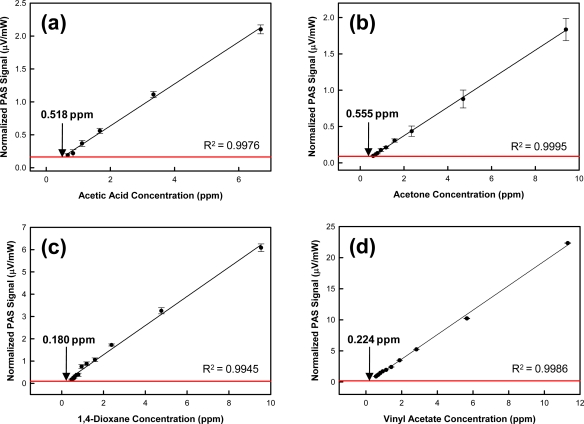
Figure 5.
Photoacoustic sensor response as a function of (a) acetic acid; (b) acetone; (c) 1,4-dioxane; and (d) vinyl acetate concentration. Error bars represent one standard deviation. The red line represents three standard deviations (3σ) of the background signal. A linear function has been fit to the data.

