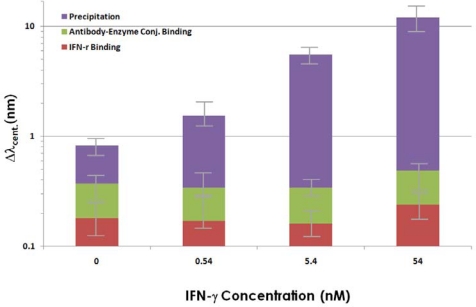
Figure 4.
Centroid shifts in the LSPR band after various concentrations of IFN-γ were bound to anti-IFN-γ 5 and after the enzyme-catalyzed precipitation reactions, which significantly amplified the signal change. Each plotted value was averaged from the five identical experiments using different NI chips for each concentration and the error bars represent the standard deviations.

