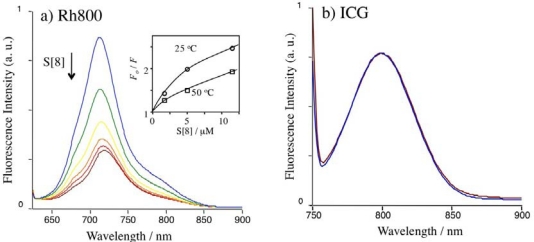
Figure 2.
Fluorescence spectra of Rh800 (a) and ICG (b) upon adding S[8] in PBS. The concentration of Rh800 and ICG was 40 nM. Excitation wavelengths were set to 600 nm for Rh800 and 725 nm for ICG. [S[8]] = 0 μM (blue line), 1.7 μM (green line), 5.0 μM (yellow line), 11.5 μM (orange line), 24 μM (red line), and 52 μM (brown line).

