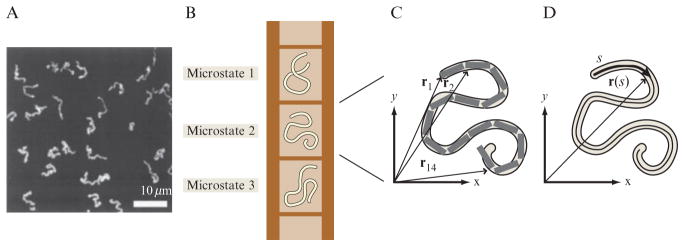
Figure 2.1.
Microstates for DNA on a surface. (A) Fluorescence microscopy image of dye-labeled λ-phage DNA on a surface (Maier and Radler, 1999). Each configuration observed corresponds to a different microstate. (B) Schematic showing a series of different allowed microstates for a given DNA molecule on a surface. (C) Discrete representation of the microstate of the DNA molecule. The molecule is divided into a series of segments and there is a vector ri which points to the ith segment. Each microstate is characterized by a different set of positions. (D) Continuous representation of the microstate of the DNA molecule. Each point on the molecule has its position defined by the vector r(s), where s is the arclength along the molecule.

