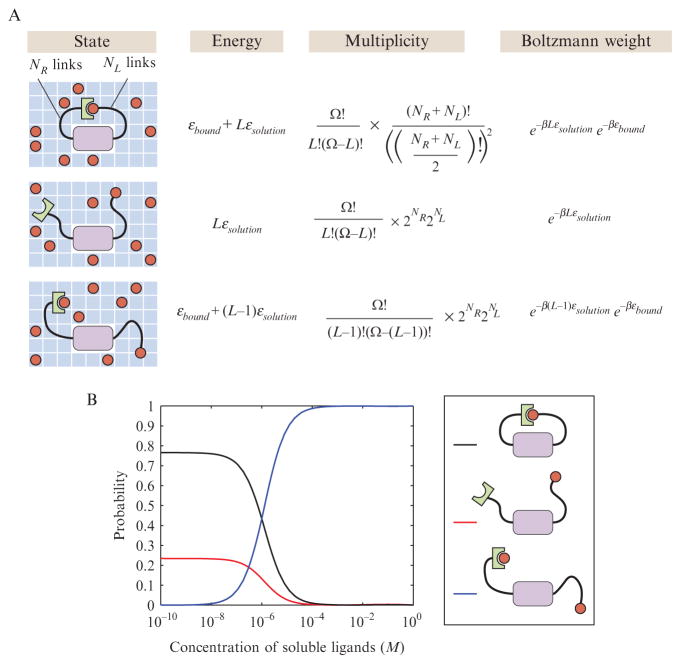
Figure 2.13.
Random-walk models of tethered ligand–receptor pairs. (A) Schematic of the tethered ligand–receptor pair and the associated statistical weights. The multiplicities for the polymer are computed using a one-dimensional toy model of the tether. NR and NL represent the number of right- and left-pointing segments out of the total N = NR + NL. The rest of the parameters are defined as in Fig. 2.3. For more realistic calculations, see Van Valen et al. (2009). (B) Concentration dependence of the probabilities of the different states that can be realized by the tethered ligand–receptor pair. The parameters used in the plot are Δε = εbound − εsolution = − 15 KBT and a probability of looping given by the one-dimensional random walk of 10−6. The volume of the elementary box v has been chosen to be approximately 1.67 nm3.

