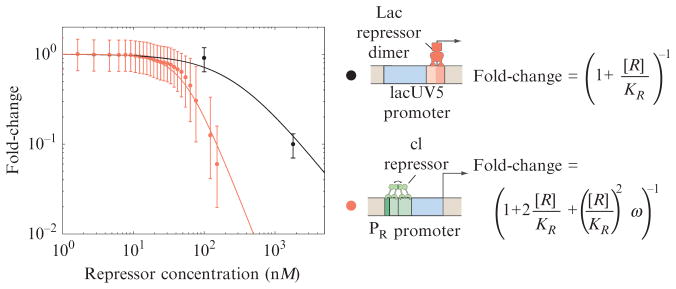
Figure 2.5.
Fold-change in gene expression. Two different promoters have been characterized as a function of the number of repressors (Oehler et al., 1994; Rosenfeld et al., 2005). The thermodynamic models predict a precise dependence of the fold-change in gene expression on the concentration of repressors. The theoretical predictions are given by the curves, and the experimental results for two different promoters are given by the data points. These predictions were obtained using the reasoning outlined in Fig. 2.4, equation 2.5, and the weak promoter approximation described in Bintu et al. (2005a,b).

