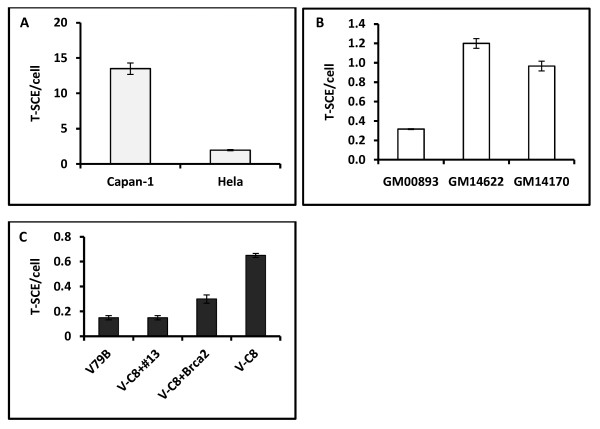
Figure 2.
Frequencies of T-SCEs in different sets of cell lines. A. Frequencies of T-SCE/cell in Capan-1 and HeLa cells. A minimum of 50 metaphases/cell line have been analyzed. Error bars represent SD. B. Frequenceis of T-SCEs in three lymphoblastoid cell lines: GM00893 (normal control) GM14622 and GM14170 (cell lines established from BRCA2 carriers). A minimum of 50 metaphases/per cell line analyzed. Error bars represent SEM. C. Frequencies of T-SCEs in a set of Chinese hamster cell lines: V79B (normal control); V-C8 (BRCA2 defective, see the text for details), V-C8+#13 (the V-C8 cell line in which the BRCA2 defect was complemented by introducing human chromosome 13 containing the BRCA2 gene) and V-C8+Brca2 (the V-C8 cell line transfetced with a BAC containing a copy of murine Brca2). A minimum of 50 cells/per cell line analyzed. Error bars represent SEM.

