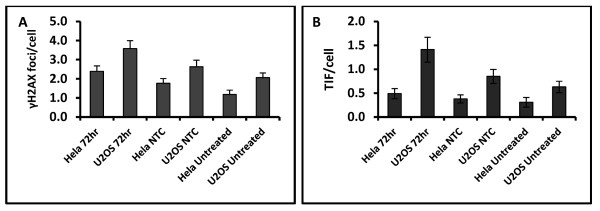
Figure 4.
DNA damage response and telomere analysis after BRCA2 depletion. A. Frequencies of γH2AX foci measured 72 hrs post transfection in U2OS and Hela. A total of 50 cells were analysed per point in two independent experiments. Error bars represent SEM B. Frequencies of TIFs in U2OS and Hela cell lines analysed 72 hrs post transfection. A total of 50 cells were analysed per point in two independent experiments. Error bars represent SEM. NTC (non-template control) represent scrambled siRNA.

