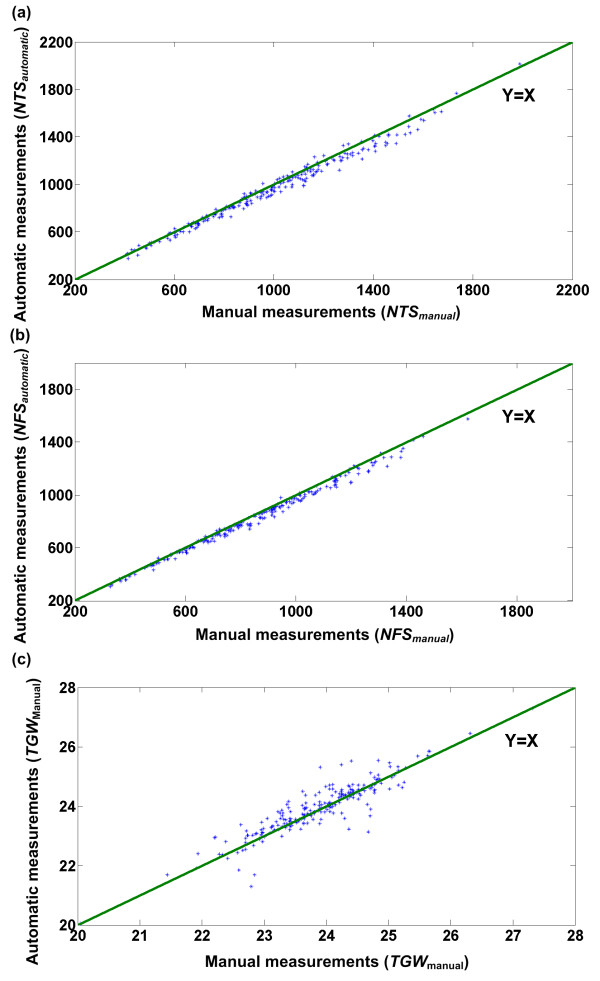
Figure 10.
Performance of the entire facility. Scatter plots of manual measurements versus automatic measurements with the facility for (a) the number of total spikelets, (b) the number of filled spikelets, and (c) the 1000-grain weight are shown. In total, 214 Huageng 295 rice plants were used as samples in the evaluation experiment. Least squares linear regression produced the following results: (a) number of total spikelets: line of best fit: y = 0.96x+10.24, correlation coefficient r = 0.992, (b) number of filled spikelets: line of best fit: y = 0.96x+6.14, correlation coefficient r = 0.996, (c) 1000-grain weight: line of best fit: y = 0.94x+1.56, correlation coefficient r = 0.91.

