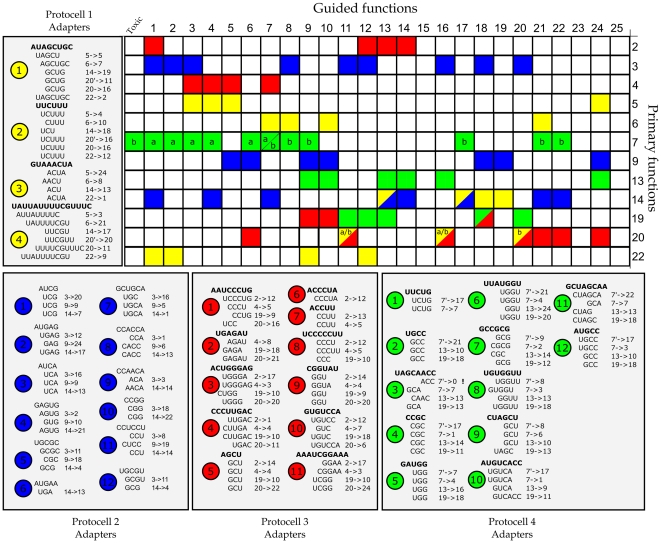
Figure 5. Evolved codes of adapter-sequence interaction sites.
Matrix depicting the transformation of primary functions into other functional conformations by guidance of adapters. Colors correspond with the best protocells evolved in four duplicate simulations ( , target set 2), only differing in random seeds. All simulations evolve their own specific molecular structure to code for information on their genome. Moreover, for all transformations, the exact code used (bounded stretch of nucleotides) is given. Rows with letters represent multiple RNA-sequences (within the same protocell) which share the same primary function, however they differ in the set of guided functions. The numbers of functions correspond to the secondary structures depicted in the method section (Figure 7), counted from the upper left.

