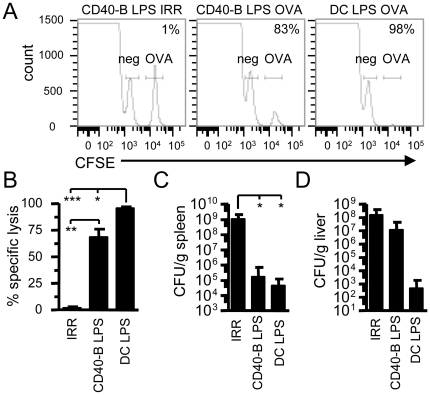
Figure 6. CD40-B cell vaccination generates functional effector.
A. In vivo killing. Mice were immunized as in Figure 2. Four days post-immunization, CFSE-labeled splenocytes pulsed or not with OVA were injected as target cells. After 4 h, the percentage of CFSEhi (OVA-pulsed; gate labeled OVA on the histogram) and CFSElo (unpulsed; gate labeled neg on the histogram) cells were analyzed in the spleen. Percentage of specific lysis is indicated on the histogram and was calculated using the indicated gate and as described in Material and Methods. B. Percentage of specific killing by OVA CD8+ Te cells. Mean +/− SEM of specific lysis are shown for the different immunization conditions. 2 mice per conditions, 3 independent experiments. C and D. Lm challenge. Four days post-immunization, mice were challenged with a lethal dose of Lm-OVA (105 CFU). 3 d post-infection (peak of bacterial load), mice were killed and CFU were determined in the spleen (C) and the liver (D). Mean +/− standard (SD) are shown. 2–4 mice per conditions, 3 independent experiments. * p<0.05, ** p<0.01 and *** p<0.001.

