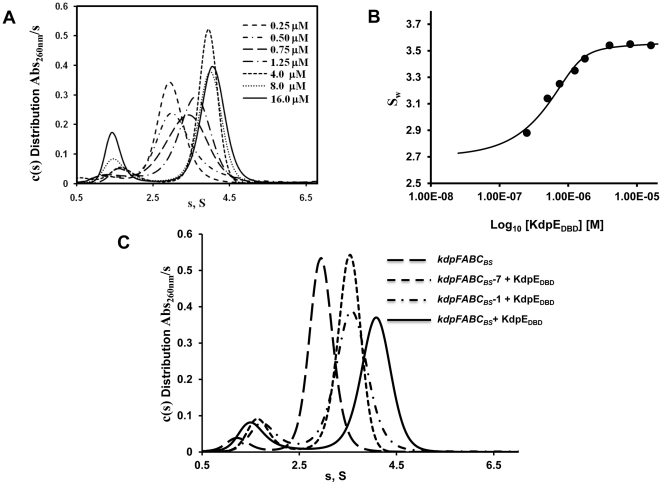
Figure 5. Sedimentation velocity analysis of KdpEDBD—kdpFABCBS association.
A. Continuous distribution of sedimentation coefficients [c(s)] as a function of increasing concentration of protein against a fixed concentration of kdpFABCBS DNA (0.5 µM). The protein concentrations used varied between 0.25 and 16 µM as shown. The largest complex with sedimentation coefficient of 4.1 S was observed at protein concentration of 4 to 16 µM. Independent experiments established the sedimentation coefficients of KdpEDBD and kdpFABCBS at 1.4 S and 2.8 S respectively (data not shown). B. A plot of the weight average sedimentation coefficients (Sw) against the concentration of KdpEDBD is shown. Analysis of the isotherm indicated that DNA was saturated beginning at 8-fold molar excess of KdpEDBD protein. C. SV c(s) distributions comparing binding of KdpEDBD to the S1 and S2 sites individually and to the both sites simultaneously. Wild-type DNA with both sites intact (kdpFABCBS), functional S1 (kdpFABCBS —7) and S2 (kdpFABCBS —1) sites were analyzed with a 16-fold molar excess of KdpDBD. Complexes with DNA possessing single sites have sedimentation coefficients of 3.5 S whereas when both sites were occupied a 4.1 S species was formed.

