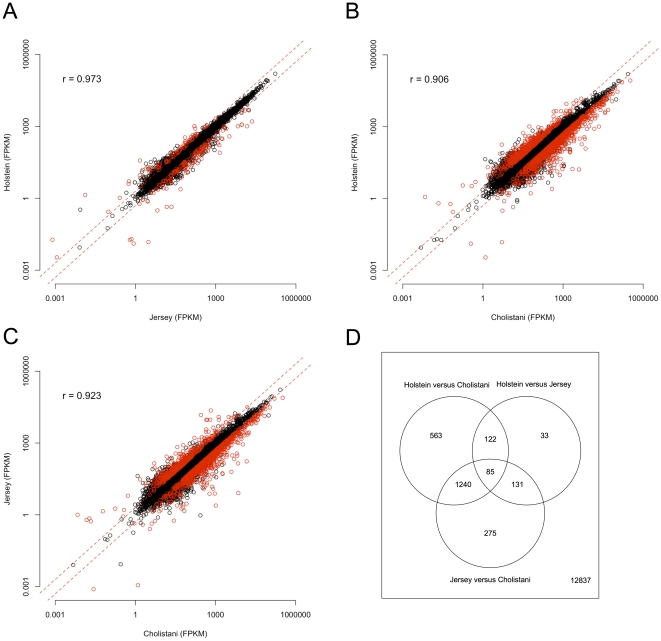
Figure 2. Comparison of overall gene expression between cattle breeds.
Gene expression from each of the three breeds was plotted against each other: Holstein versus Jersey (A); Holstein versus Cholistani (B); and Jersey versus Cholistani (C). Also shown in each scatter plot were two dashed lines indicating 2-fold change. Red circles indicated genes differentially expressed significantly by at least two fold. In (D), a Venn diagram was shown for overlap between genes that showed significant differential expression in each of the three pair-wise comparisons.

