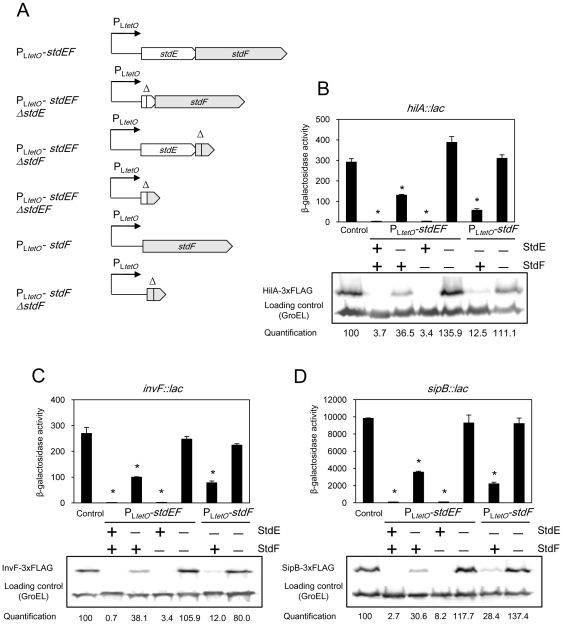
Figure 5. Downregulation of SPI-1 by StdE and StdF.
A. Diagram representing PLtetO -stdEF and PLtetO -stdF constructions, and their respective deletion controls lacking stdE, stdF, or both. B–D. Expression of hilA, invF, and sipB in strains carrying a native std operon (control), PLtetO -stdEF, PLtetO -stdF, and their respective control constructs. Histograms represent ß-galactosidase activities of hilA::lac, invF::lac, and sipB::lac fusions. An asterisk indicates a statistically significant difference (P<0.005) compared to the control. HilA-3XFLAG, InvF-3xFLAG, and SipB-3xFLAG levels were determined by Western blotting using anti-FLAG antibodies. GroEL was used as loading control. For quantification, the ratio tagged protein/GroEL was relativized to 100 in control samples. The symbols “+” and “−”indicate the presence or the absence of StdE or StdF.

