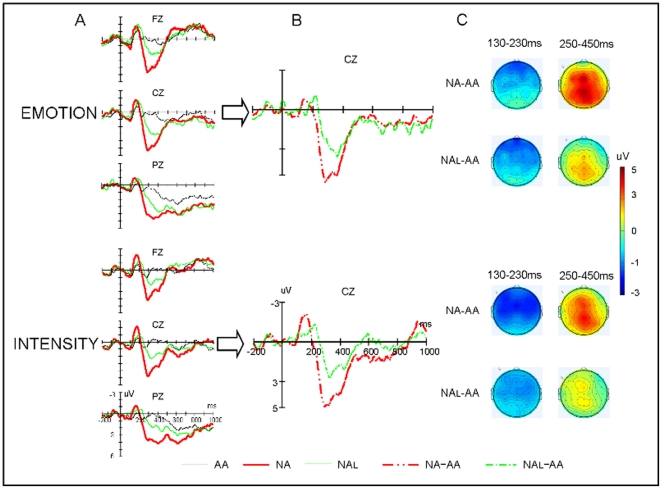
Figure 3. Grand-average ERP waveforms for critical prosodies.
A: ERPs elicited by three types of prosodies at selected electrode sites. In this figure, the amplitude (in microvolt) is plotted on ordinate (negative up) and the time (in milliseconds) is on abscissa. B: Difference waves (NA minus AA versus NAL minus AA). C: Topographies of difference curves (viewed from the top) in the selected time periods.

