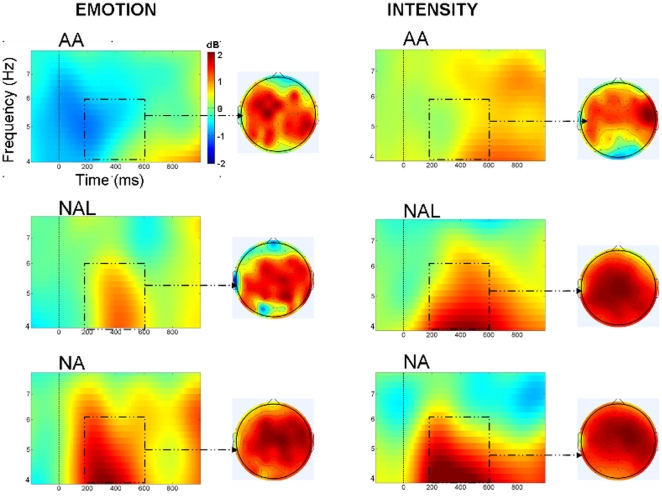
Figure 4. The average oscillatory activities for various critical prosodies and task conditions.
The time–frequency map shows oscillatory activities at Cz electrodes the over time (x-axis; 0 is onset of splicing point) and frequency (y-axis). Red colors indicate more power increase and blue colors indicate more power decrease relative to baseline. Topographical map show data taken from a 100- to 600-ms, 4- to 6-Hz window.

