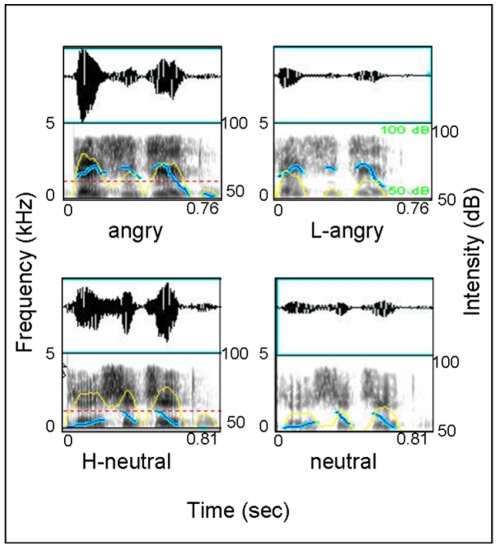
Figure 6. Acoustic feature for four prosody types used in Experiment 1.
The dataset consists of oscillogram (up) and voice spectrographs (down) with uncorrected pitch contours (blue line) and intensity contours (yellow line) superimposed. As shown, angry prosodies have higher mean F 0 (197 Hz vs. 132 Hz, t(49) = 28.12, p<.001) and intensity (70 dB vs. 63 dB, t(49) = 23.18, p<.001), and faster speech rate (206 ms vs. 216 ms per syllable, t(49) = 5.43, p<.01) than neutral prosodies, however, the intensity modified H-neutral and L-angry prosodies share same level of intensity with angry and neutral prosodies respectively while other acoustic parameters remain unchanged.

