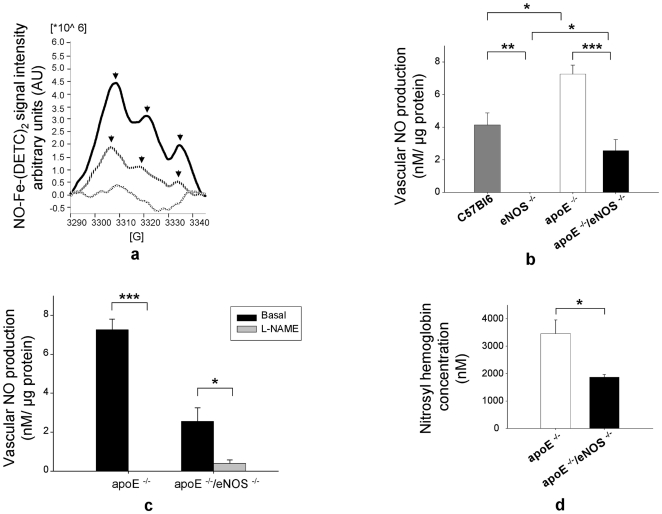
Figure 5. eNOS is a significant source of vascular wall NO production and circulating NO.
a) ESR spectrum of NO-Fe-(DETC)2 in aortas of apoE−/− and apoE−/−/eNOS−/−. Bold lines indicate apoE−/−, stripped lines apoE−/−/eNOS−/− and patterned lines buffer/spin trap alone. Arrows show the typical 3 peaks NO-Fe-(DETC)2 signal. b) Vascular NO production in C57BL/6J (n = 12), eNOS−/− (n = 8), apoE−/− (n = 14) and apoE−/−/eNOS−/− (n = 15), *p≤0.01, **p<0.001, ***p<0.0001). c) Vascular NO production with NOS inhibition using L-NAME in apoE−/− (n = 11) and apoE−/−/eNOS−/− mice (n = 16), *p<0.01, ***p<0.0001. d) Nitrosyl hemoglobin concentration of blood samples from apoE−/−/eNOS−/− (n = 11) vs. apoE−/− controls (n = 13, *p = 0.01).

