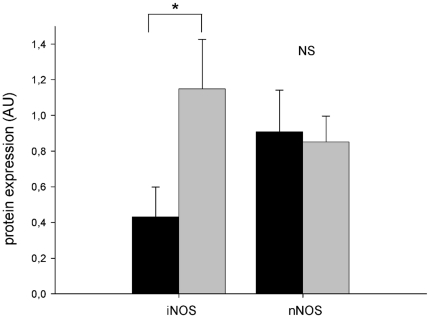
Figure 7. Vascular expression of NOS isoforms.
Significantly increased expression of iNOS protein in the aorta of apoE−/−/eNOS−/− (n = 10) compared to apoE−/− mice (n = 10). The protein levels of nNOS did not differ between apoE−/− (n = 10) apoE−/−/eNOS−/− (n = 11). * p<0.05, NS denotes non-significance.

