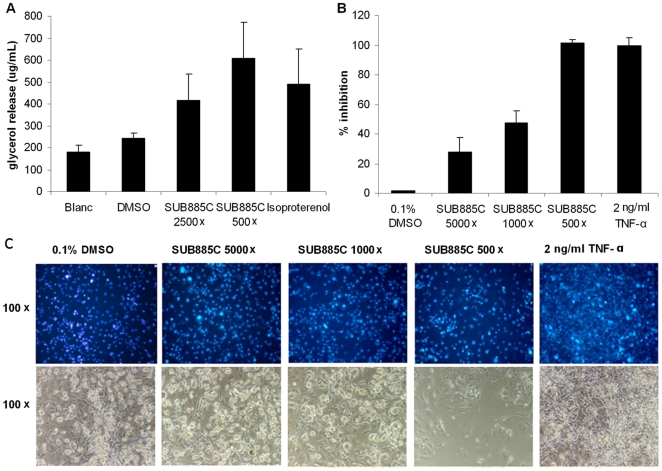
Figure 4. Adipolytic and adipogenic activities of SUB885C in 3T3-L1 adipocytes.
(A) Glycerol release as the result of adipolysis in 3T3-L1 adipocytes after incubation with SUB885C (500× and 2500× diluted) and 20 µM isoproterenol dissolved in DMSO with 1% as final concentration. (B) Inhibition of adipose conversion in differentiating 3T3-L1 adipocytes by SUB885C. (C) Morphological analysis of the differentiated 3T3-L1 adipocytes. The cells were treated with 20 µg/ml DAPI (top row), which stained the nuclei of the cells and gave an indication of cell numbers. The phase contrast of the microscope showed the outlines of the cells (bottom row) and gave an overview of cell density and morphology. The magnification is on the left.

