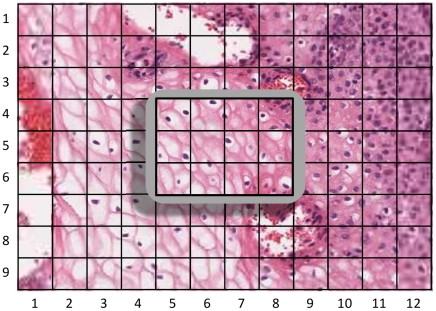
Figure 8. An illustration of smart caching.
The gray rectangle in the middle of the image indicates the Microsoft Surface table. The grids in row 4–6 and column 5–8 are the 12 grids shown on screen. The rest of the grids are all cached in the background. Some of the cached grids are designed to use low resolution images (blurry) to save memory usage. The black grid boundary lines do not exists in SurfaceSlide; it is drawn here for illustration purpose only.

