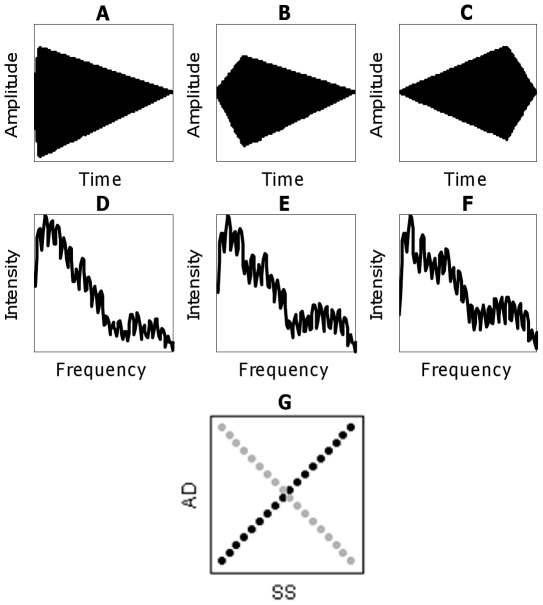
Figure 1. Example stimuli used in the present experiments.
The first row shows steps 1 (A; shortest attack/longest decay), 9 (B; intermediate attack/decay) and 18 (C; longest attack/shortest decay) out of 18 in the AD series. The second row shows steps 1 (D; most-French-horn-like), 9 (E; intermediate mixture) and 18 (F; most-tenor-saxophone-like) out of 18 in the SS series, with frequency axes magnified (shown only up to 6 kHz) to emphasize differences in spectral envelopes. The third row shows examples of the two experimental conditions. Black circles depict stimuli that obey a positive correlation between AD and SS (i.e., lie on a main diagonal of the stimulus matrix; Consistent condition). Grey circles depict stimuli that violate that correlation (i.e., lie on the perpendicular diagonal; Orthogonal condition). Examples in 1G depict no overall correlation between AD and SS, but experiments present a high ratio of Consistent∶Orthogonal sounds to introduce correlation among complex acoustic attributes. In counterbalanced conditions, grey sounds support a negative correlation between AD and SS while black sounds directly violate it. Figures 1A and 1D correspond to the black circle in the lower-left corner of 1G, figure 1C to the grey circle in the upper-left corner, and figure 1F to the grey circle in the lower-right corner.

