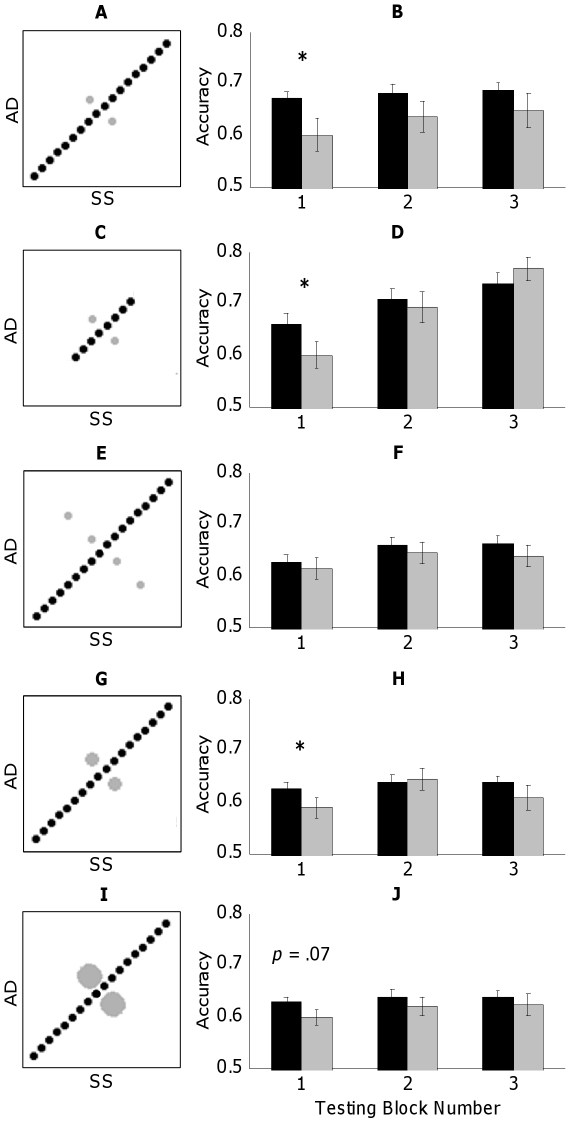
Figure 2. Stimuli and behavioral results for all experiments (black = Consistent condition, grey = Orthogonal condition).
Stimulus representations follow Figure 1G. While only positive correlations are shown, experiments were counterbalanced between positive and negative correlations. All behavioral results depict proportion correct discrimination on the ordinate and testing block number on the abscissa. Stimuli (A) and results (B) for Experiment 1 (base design; r = ±0.98). Stimuli (C) and results (D) for Experiment 2 (truncation of evidence supporting the correlation; r = ±0.81). Stimuli (E) and results (F) for Experiment 3 (expansion of evidence supporting the orthogonal dimension; r = ±0.83). Stimuli (G) and results (H) for Experiment 4 (threefold increase in sampling Orthogonal stimuli; r = ±0.95). Stimuli (I) and results (J) for Experiment 5 (tenfold increase in sampling Orthogonal stimuli; r = ±0.83). * indicates significant difference (p<.05) as assessed by paired-sample two-tailed t-tests.

