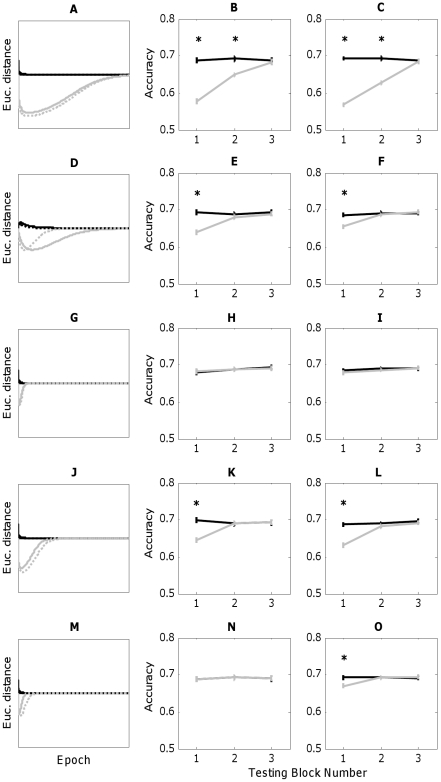
Figure 4. PCA network simulations (left column) and choice model performance (center, right columns) for all experiments (black = Consistent condition, grey = Orthogonal condition).
The first row corresponds to Experiment 1, the second row to Experiment 2, etc. In PCA simulations (A, D, G, J, M), Euclidean distance between test stimuli is on the ordinate and simulation epoch on the abscissa. Solid lines portray predictions made by the correlation-based model, while (often highly overlapping) dashed lines portray predictions of the covariance-based model. Choice model performance (center, right columns) plots proportion correct discrimination on the ordinate and testing block number on the abscissa. Choice model performance based on the correlation-based PCA model is shown in the center column (B, E, H, K, N), and performance based on the covariance-based PCA model is shown in the right column (C, F, I, L, O). Choice model patterns of performance for both correlation and covariance are identical for Experiments 1–4. However, the correlation model fails to predict listeners' superior discrimination of statistically consistent sound pairs (O) early in Experiment 5 (N) while the covariance-based model successfully predicts this performance.

