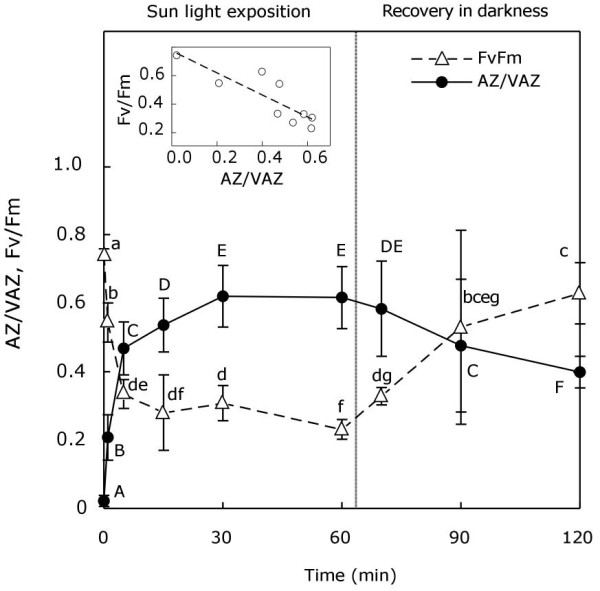
Figure 1.

De-epoxidation index of V-cycle (close cyrcles) and variations in Fv/Fm (open triangles) during light-darkness treatment. Each point represents the mean ± SE (n = 5). Capital letters above circles show significant differences in the AZ/VAZ among times (P < 0.05). Small letters above triangles represent significant differences in the Fv/Fm among times (P < 0.05). Correlation between AZ/VAZ and Fv/Fm is shown in the inset (Pearson's correlation coefficient; r = 0.74).
