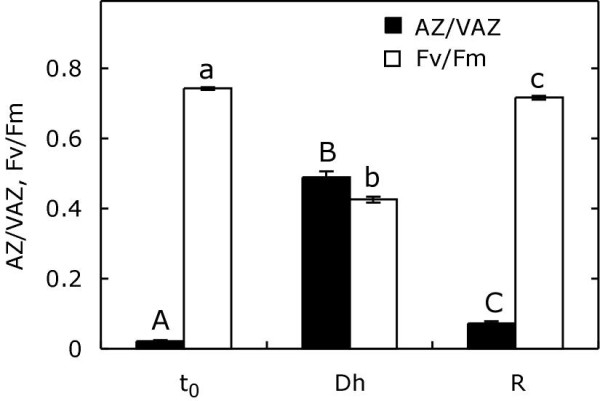
Figure 2.

De-epoxidation index of V-cycle and variations in Fv/Fm during a dehydration-rehydration treatment in darkness. Dehydration (Dh) was performed at 75% RH for 24 h. V-cycle de-epoxidation index is represented by closed bars and Fv/Fm by open bars. Each bar represents the mean ± SE (n = 5). Letters above bars indicate significant differences for AZ/VAZ (A, B and C) and for Fv/Fm (a, b, c) along treatment (P < 0.05).
