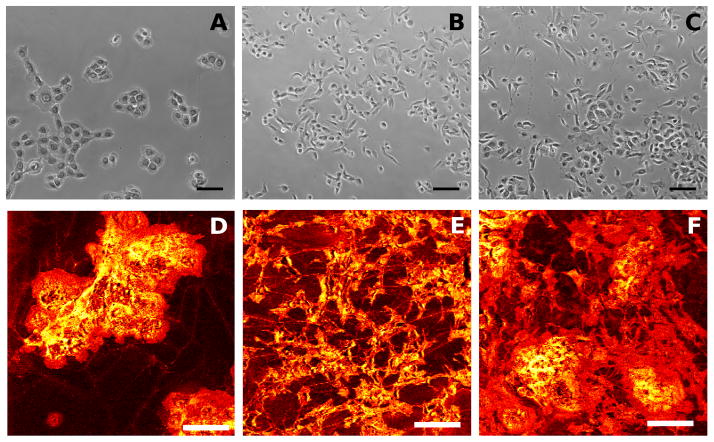
Figure 1.
Phase contrast images (A–C) and ToF-SIMS total ion images (D–F) of isolated and heterogeneous cultures. The images are as follows: Rat esophageal epithelial cells (A and D); NIH 3T3 mouse fibroblasts (B and E); Heterogeneous mixture of rat esophageal epithelial cells and 3T3 fibroblasts (C and F). Scale bars represent 100 μm.

