
Fig. 1.
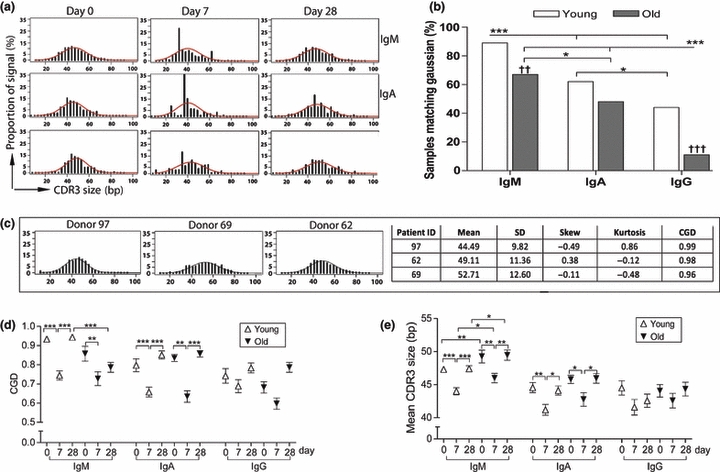
B-cell CDR3 spectratypes show individual variability and show challenge-related changes. (a) Spectratypes of samples from one individual before, and at 7 and 28 days after, receiving winter vaccination for influenza and pneumonia, showing CDR3 size distribution histograms for the IGHM, IGHA and IGHG immunoglobulin genes in peripheral blood B cells. The best fit Gaussian distribution curve for each sample, as determined based on the mean and SD values, is overlaid. The X-axis represents the CDR3 size in nucleotides, and the Y-axis is the proportion of the CDR3 sequences at each size. (b) Spectratype data show that diversity of repertoire decreases with age and with change from IGHM to switched isotypes on day 0 before challenge. High correlation to the underlying Gaussian distribution (CGD) is an indicator of a high level of diversity in the population. The Y-axis shows the per cent of spectratypes that have a correlation value of over 0.9 in each group. Variables were compared using chi-squared test with Bonferroni post-test, and significant values for comparisons between isotypes are indicated using * and between ages are indicated by †. (c) CDR3 spectratypes can follow a Gaussian distribution but may still differ between individuals. Examples of IGHM spectratypes from three different young individuals before vaccination are shown, with differing mean, SD, skew, kurtosis and CGD values. (d) Challenge and age-related changes in repertoire diversity as indicated by the spectratype correlation to the baseline CGD in the young and old age groups of different isotypes before, and at 7 and 28 days after vaccination. Groups were compared using Mann–Whitney u-test. (e) Challenge and age-related changes of the mean CDR3 length. Groups were compared using Mann–Whitney u-test. Error bars are SEM, *P < 0.01, **P < 0.001 and ***P < 0.0001.