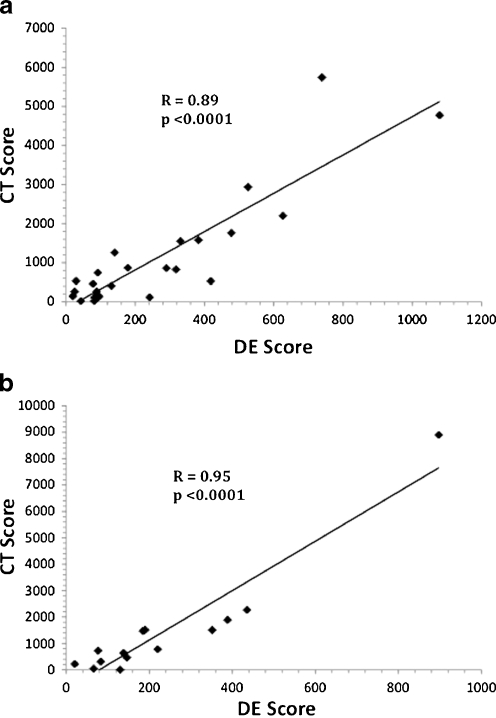
Fig. 3.
Correlation of DE and CT scores: a. Test cohort DE score versus CT score. The DE scores of the test cohort (n = 25) are plotted against their respective CT scores. b. Validation cohort DE score versus CT score. The DE scores of the validation cohort (n = 14) are plotted against their respective CT scores

