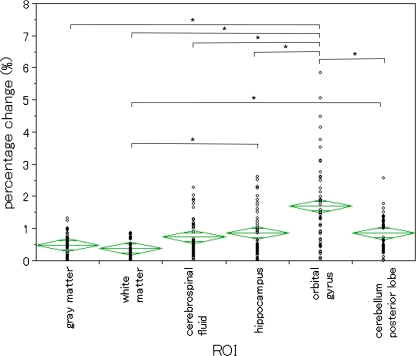
Fig. 2.
Repeatability by the atlas-based method in non-smoothed images. We showed percentage changes in each ROI. The breadth of each green rhomboid shows the number of cases in the group, the height shows the 95% confidence interval, the middle line shows the average of the group, and the horizontal lines in the upper and lower parts show the overlap marks. There was a significant difference in ANOVA (P < 0.05). In addition, where there was a significant difference in the Tukey–Kramer method, (*) is displayed. Percentage change value for OG was larger than the percentage change values for all ROIs

