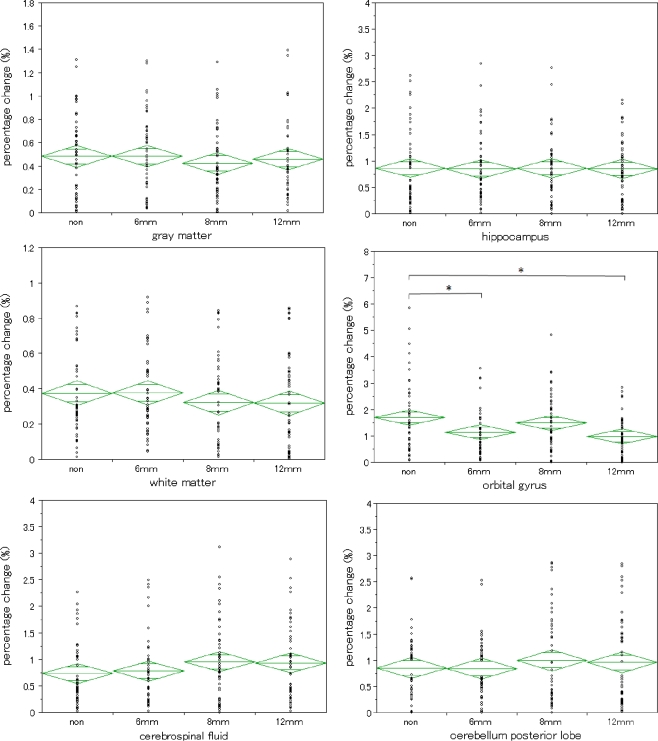
Fig. 3.
Repeatability by atlas-based method in smoothed images. The breadth of each green rhomboid shows the number of cases in the group, the height shows the 95% confidence interval, the middle line shows the average of the group, and the horizontal lines in the upper and lower parts show the overlap marks. For white matter (left middle), cerebrospinal fluid (left bottom), hippocampus (right top), and cerebellum posterior lobe (right bottom), there were no significant differences in ANOVA. For orbital gyrus there was a significant difference in ANOVA (P = 0.0020). For only orbital gyrus, repeatability by the atlas-based method was improved by using smoothed images

