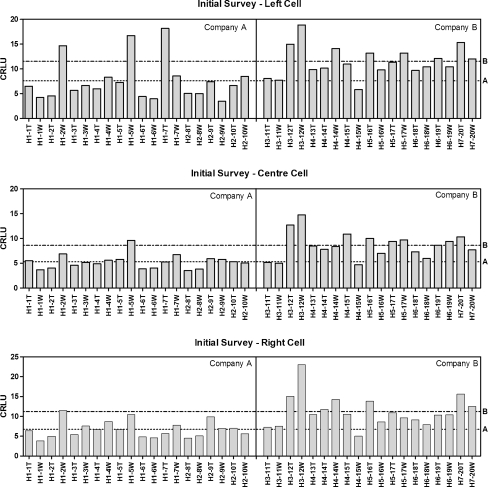
Fig. 3.
Initial survey of regional CR systems using standard exposure conditions for left (top), center (middle), and right (bottom) AEC-enabled exposures. A large difference in mean-CRLU is evident with manufacturer and AEC cell. Dotted line is the mean of company A (left, 7.6 ± 4.2; center, 5.3 ± 1.4; right, 6.7 ± 2.1) and dot–dash line is the mean of company B (left 11.5 ± 3.0; center, 8.6 ± 2.6; right, 11.2 ± 4.0). T table, W wall, H hospital number

