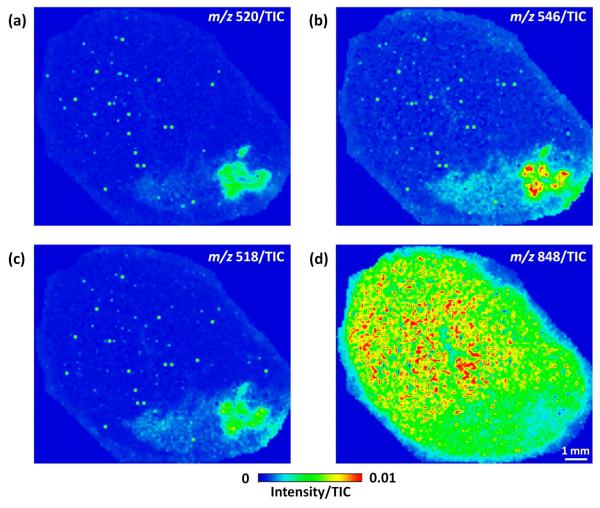
Figure 5.
MS images for the [M+K]+ of LPE 18:0 at m/z 520 (a), the [M+Na]+ of LPC 18:0 at m/z 546 (b), the [M+Na]+ of LPC 16:0 at m/z 518 (c), and the [M+K]+ of PC (18:0/20:4) at m/z 848 (d) from a heart following LAD coronary artery ligation. All images were generated by plotting the ion intensity divided by the TIC.

