
Figure 4.
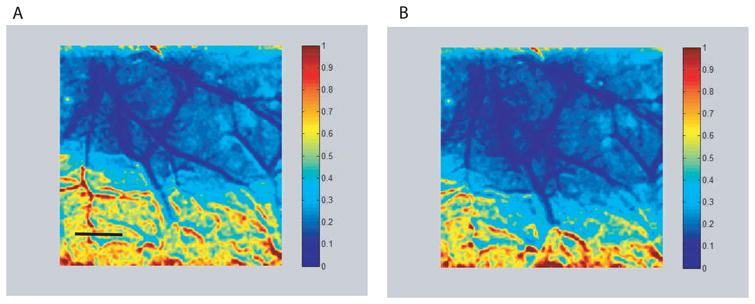
Speckle images showing changes in cerebral blood flow (CBF) with respect to blood flow just prior to filament occlusion of the MCA. The image on the left (A) was obtained following MCA occlusion but prior to start of vagus nerve stimulation, while the image on the right (B) was obtained during a 30 second train of stimulation pulses to the vagus nerve. There is a dramatic decrease in CBF in the MCA territory. Note the similarity of the two images with no apparent increase in CBF due to stimulation. The numbers on the color scale are fractions of the pre-occlusion CBF and the scale bar in panel A is 1 mm.