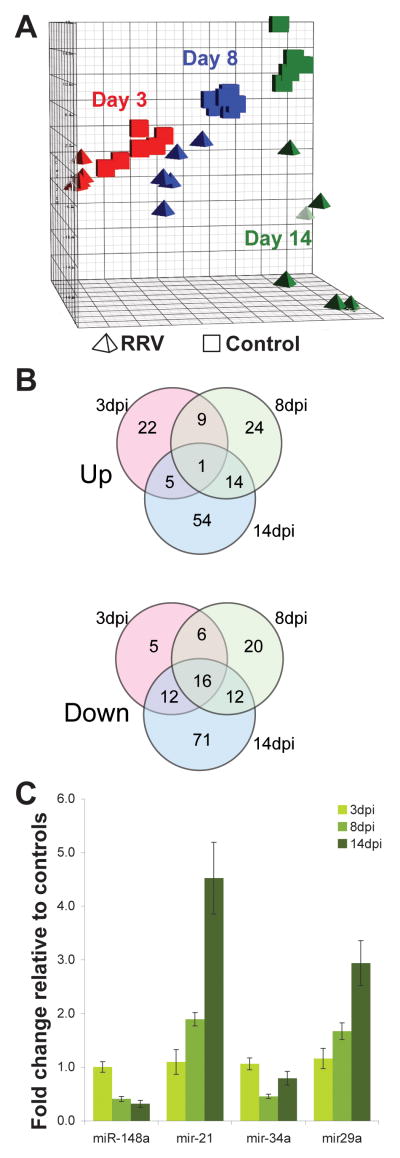
Figure 1.
MicroRNA microarray summary and validation. (A) Principal component analysis of miRNA microarray data. Samples from saline-injected mice, cubes; RRV-injected, tetrahedra. Red, blue, and green represent 3dpi, 8dpi and 14dpi time points respectively. (B) Number of significantly increased and decreased miRNAs at each time point. See Supplemental Table 1 for listing of miRNAs in Fig 1B. (C) Confirmatory qPCR of selected miRNAs at the indicated time points.

