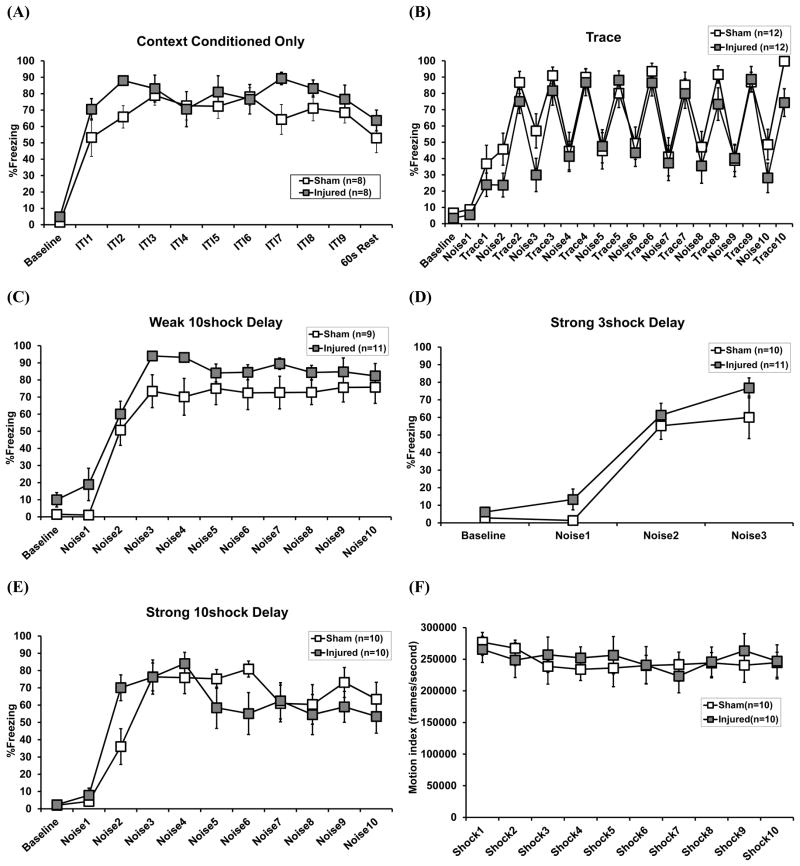
Figure 2.
Performance during acquisition of Pavlovian fear conditioning for each of the five training procedures.Graphs represent freezing to the novel context prior to shock presentation (Baseline), freezing during the post-shock inter-trial intervals (ITIs) (context conditioned group only, A), to the white noise cues (B-E) and freezing during the trace intervals (trace group only, B). Behavioral reactivity to 0.9 mA footshock was also examined in the strong ten shock delay procedure (F). Data are represented as the mean ± s.e.m.

