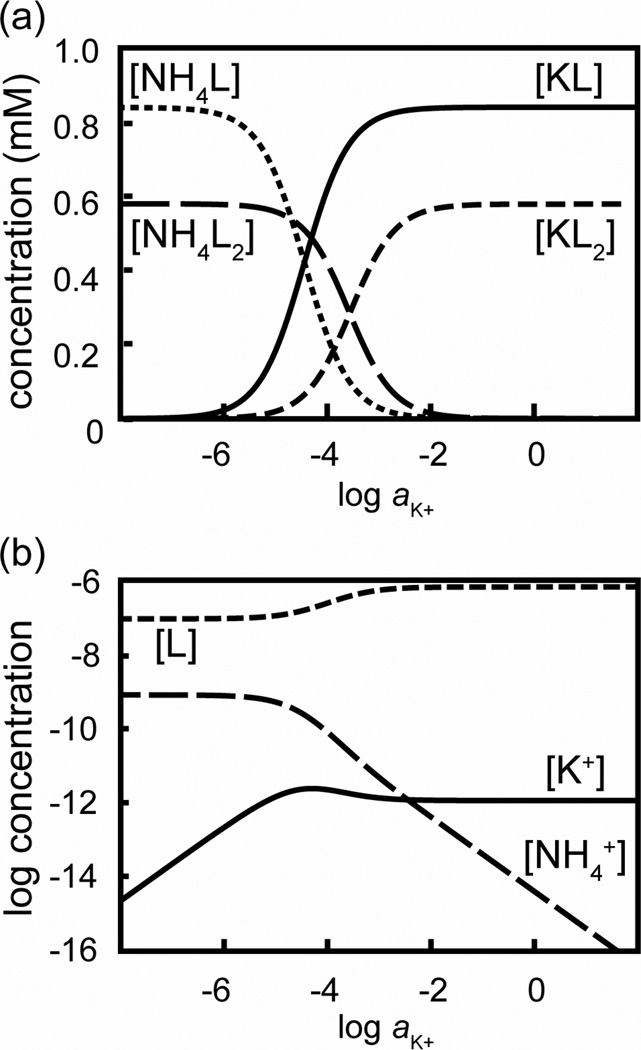
Figure 5.
Calculated composition of an ISE membrane based on ionophore 1 and 71 mol % ionic sites when exposed to 2 mM NH4+ and a varying activity of K+, corresponding to the K+ response in a NH4+ background shown in Figure 2: Membrane concentrations of (a) complexes between ionophore and K+ and NH4+, and (b) free ionophore and free K+ and NH4+ ions (note the logarithmic scale). All parameters used to calculate these concentrations are the same as for the fit of the EMF in a Cs+ background, as shown in Figure 3 (broken line) except for Kex= 10−0.55, KNH4L =1012.9 and KNH4L2 = 107.0, which are specific to NH4+.

