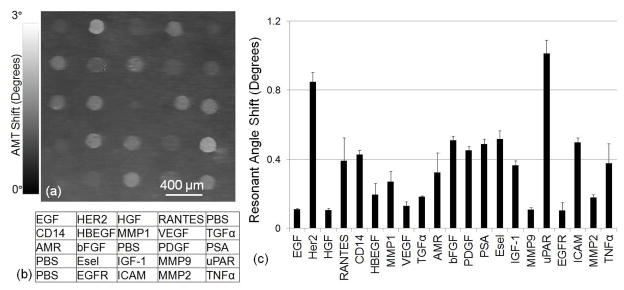
Figure 3.
Label-free characterization of the density of antibody capture spots by measuring shifts in the λ=690 nm resonance. (a) Image of the shift in the Angle of Minimum Transmission (AMT) for a representative array of antibody capture spots, representing a label-free measurement of the capture spot density. (b) Layout of the capture antibodies within an array. (c) Average net AMT shift values for the capture antibodies with error bars representing one standard deviation of from four replicate arrays on the same chip. Measurements indicate a large variability in capture spot density that is dependent on the specific antibody, but excellent reproducibility for a particular antibody.

