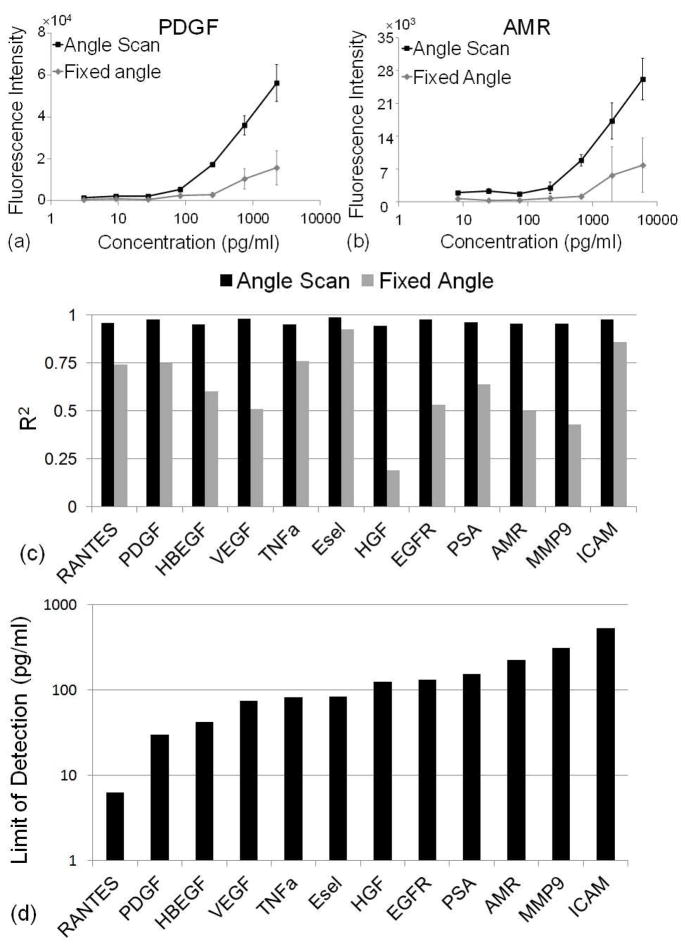
Figure 5.
Dose-response curves for (a) PDGF and (b) AMR where black and gray curves are from angle-scanning and fixed angle scanning method respectively. Error bars represent one standard deviation from four replicate spots. (c) Comparison of R6 for the 4-parameters logistic curve fitting algorithm for both angle scanning and fixed angle methods. (d) LODs based on the angle scanning method. Only assays with R6 > 0.95 from four parameter logistic curve fitting were listed here.

