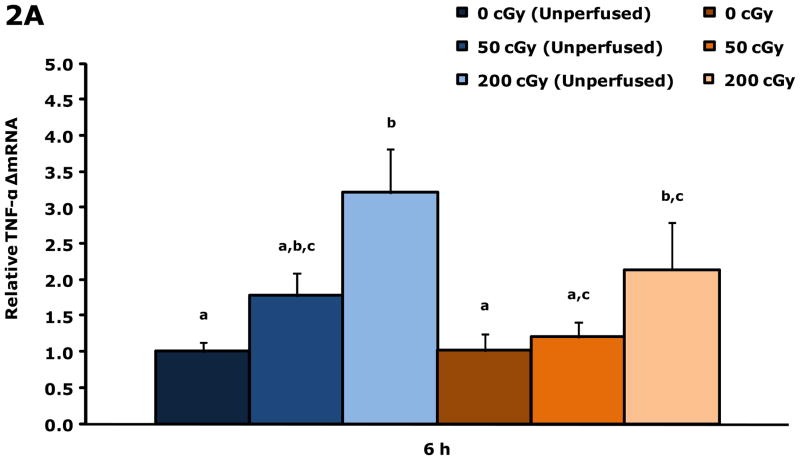
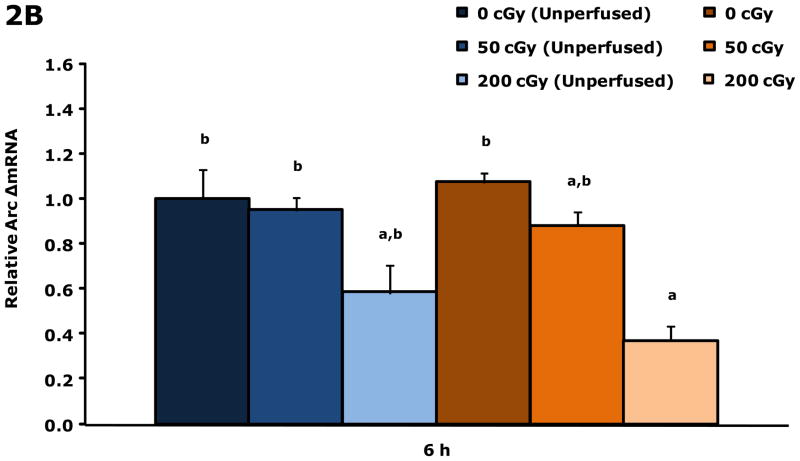
Figure 2. Gamma radiation up-regulates gene transcripts for TNF-α and Arc in whole brain 6 h post irradiation.
Restraint-10 mice were exposed to 50 or 200 cGy of gamma radiation (44.5 ± 0.1 cGy/min) as indicated. qPCR was used to quantify mRNAs from un-perfused and perfused whole brains as indicated 6 h post irradiation. Results are expressed as relative fold change in mRNA expression (ΔmRNA), means ± s.e.m.; n = 4–6. (A) TNF-α: main effect of dose (P < 0.001) and perfusion (P = 0.042); P < 0.05, 200 cGy (unperfused) v. sham IR (unperfused), sham IR, 50 cGy (3.205 ± 0.252 v. 1.000 ± 0.166, 1.017 ± 0.286, 1.201 ± 0.241, respectively); P < 0.05, 200 cGy v. sham IR (unperfused), sham IR (2.139 ± 0.387 v. 1.000 ± 0.166, 1.017 ± 0.286, respectively). (B) Arc: main effect of dose (P = 0.003); P < 0.05, 200 cGy v. sham IR (unperfused), 50 cGy (unperfused), sham IR (0.370 ± 0.076 v. 1.000 ± 0.239, 0.951 ± 0.211, 1.074 ± 0.107, respectively).


