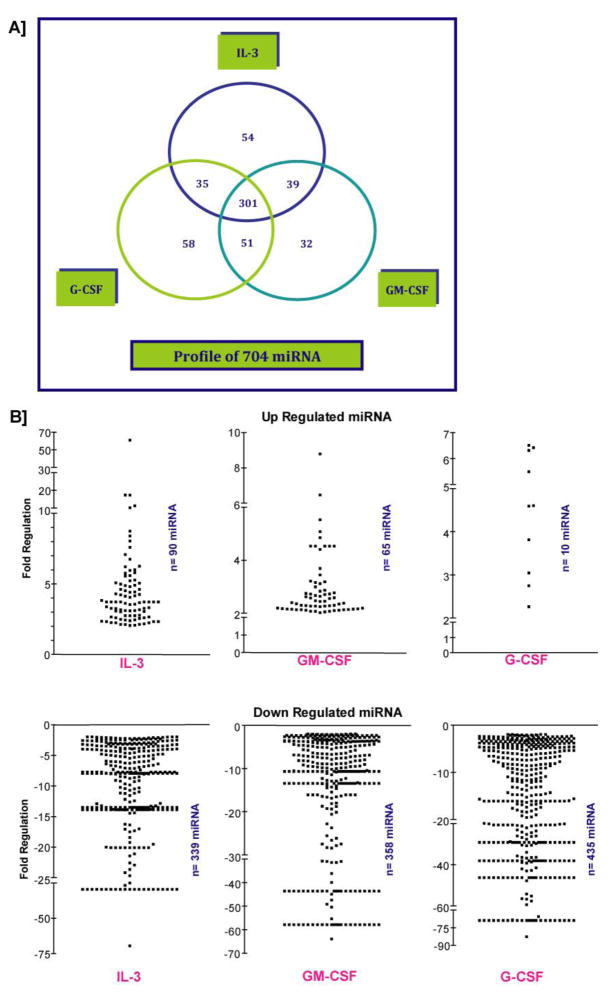
Figure 2. Profiling outcomes of IL-3, GM-CSF, and G-CSF regulated miRNA in AML-193 cells.
A. A three-way Venn diagram illustrating the comprehensive miRNA profiling outcome by three different cytokines. 301 miRNAs were commonly regulated by IL-3, GM-CSF and G-CSF. B. Individual scatter plots for up- and down- regulated miRNAs. 90 miRNAs were upregulated by IL-3 and 339 miRNAs were down regulated. GM-CSF elevated the expression of 65 miRNAs and decreased expressions of 358 miRNAs. G-CSF upregulated 10 miRNAs and downregulated 453 miRNAs. As previously mentioned, fold change filters were applied to select the miRNAs that were regulated more than 2-fold.

