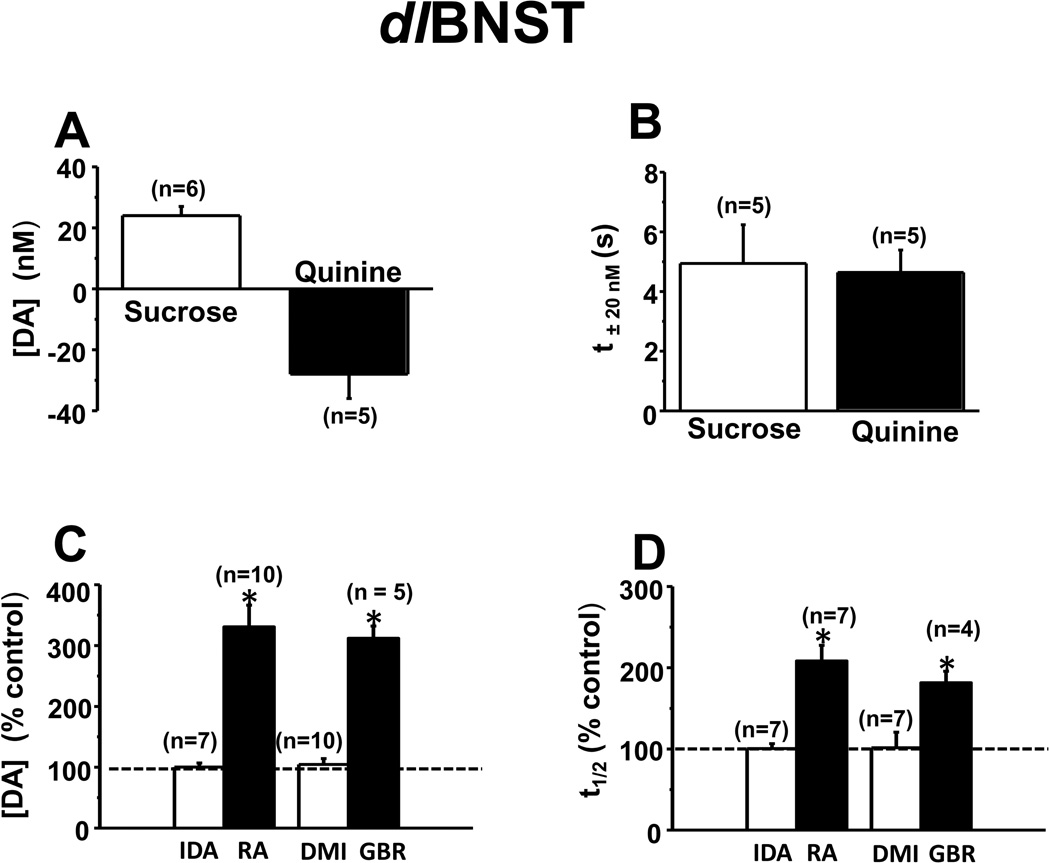
Figure 3.
Average concentration change and time course for dopamine in the dlBNST. (A) Maximal dopamine concentration change measured in response to infused tastants (P < 0.005 for sucrose, P < 0.01 for quinine). (B) Time for dopamine to change by 20 nM (t±20nM) after initiation of tastant infusion. (C, D) Effect of idazoxan (IDA, 5 mg/kg), desipramine (DMI, 15 mg/kg), raclopride (RA, 2 mg/kg) and GBR 12909 (GBR, 15 mg/kg) on electrically evoked dopamine release. (C) Maximal dopamine concentration ([DA]) and (D) time to clear the released dopamine to half of its maximal concentration (t1/2). * Indicates significantly different from control values (P < 0.05).

