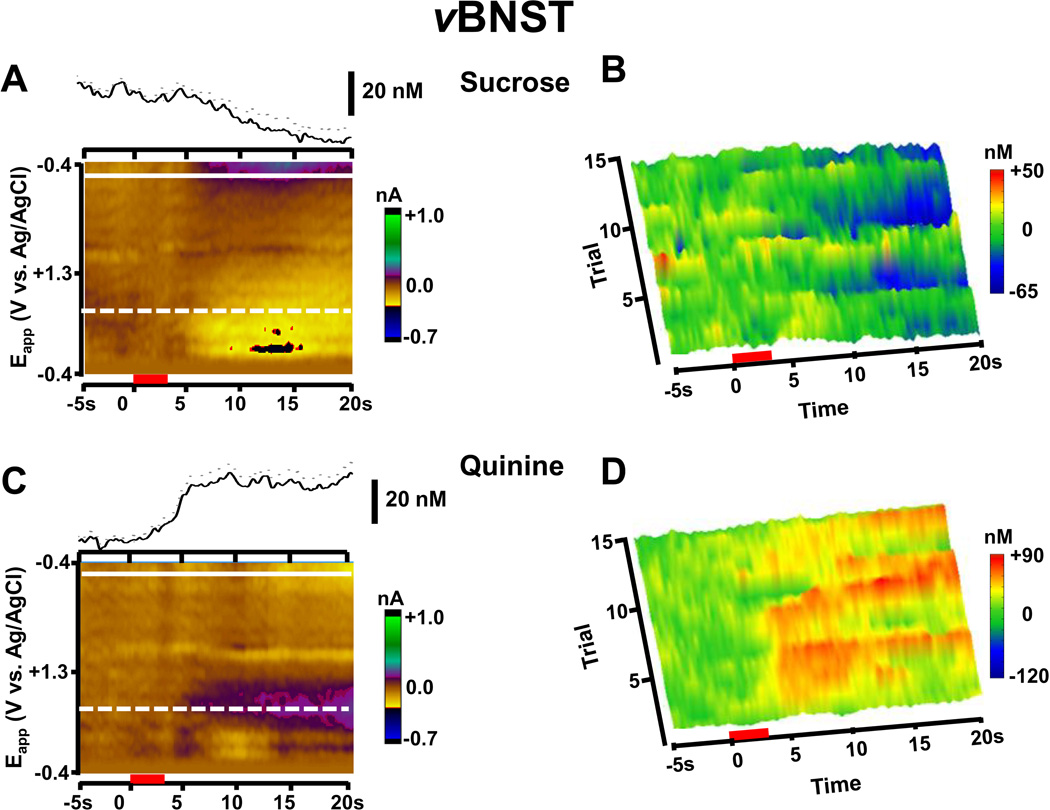
Figure 4.
Norepinephrine signaling in the vBNST in response to palatable and aversive tastants in a single animal. (A) Intra-oral infusions of sucrose decrease norepinephrine release. The upper trace is the average norepinephrine concentration change over 15 trials in response to intra-oral sucrose infusions in a single animal (infusions during the red bar). The color plot shows the averaged cyclic voltammograms collected during the 15 trials. White lines are as in Figure 2(A). (B) Trial-by-trial changes of norepinephrine concentration from the animal shown in (A) in response to intra-oral sucrose infusion. (C) Upper trace is the average norepinephrine concentration change over 15 trials in response to intra-oral infusions of quinine in a single animal (infusions during the red bar). The color plot shows the average of all of the cyclic voltammograms collected during the 15 trials in this animal. (D) Trial-by-trial changes of norepinephrine concentration from the animal shown in (C) in response to intra-oral infusions of quinine. In (A) and (C) the mean is given by the solid lines and ± s.e.m. is given by the dotted lines.

