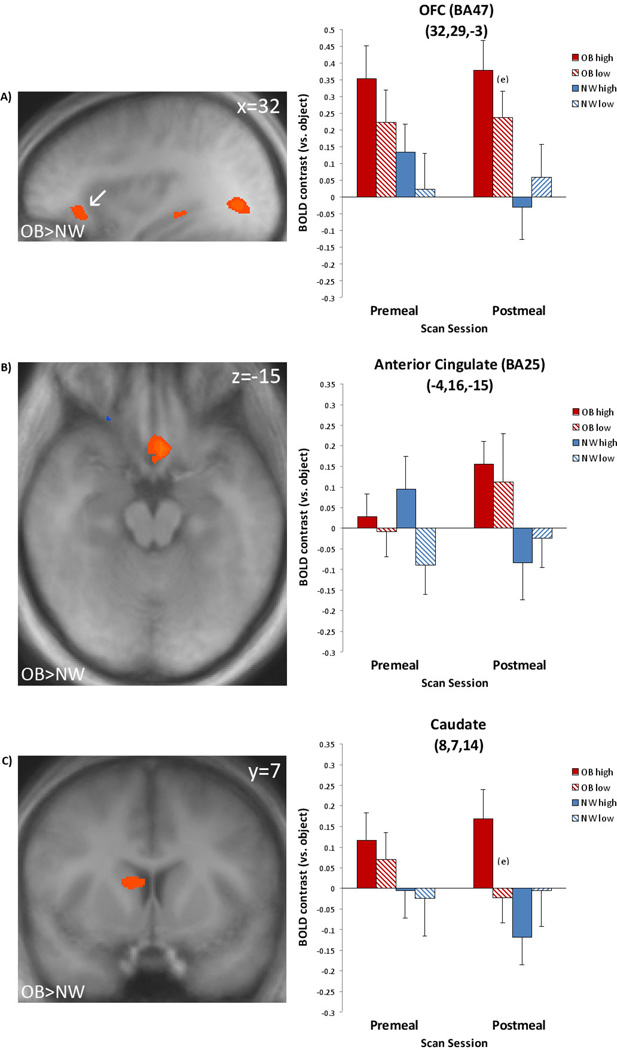
Figure 2.
Obese vs. Normal-Weight. Left: Post-meal scan results. Increased obese group activation to high-calorie vs. object cues during postmeal condition in A) lateral OFC/BA47, B) anterior cingulate/BA25, and C) Caudate. Significant activation to high-calorie food cues (p < .05, corrected) is shown in shades of red. Coordinates are given in standard Talairach space. Right and left are reversed by radiologic convention. Right: Magnitude of average activation for high calorie and low calorie foods at premeal and postmeal. Beta values reflect BOLD contrast averaged across voxels in region for calorie type relative to objects. BA=Brodmann Area, NW=normal-weight, OB=obese, OB high=obese group, high-calorie food cue, OB low=obese group, low-calorie food cue, NW high=normal-weight group, high-calorie food cue, NW low=normal-weight group, low-calorie food cue. esignificant difference (p < .05) in post-hoc t-tests : obese group, high- vs. low-calorie, postmeal condition.

