
Figure 1. Force Application to Cadherin Induces Oriented Monopolar Protrusive Behavior.
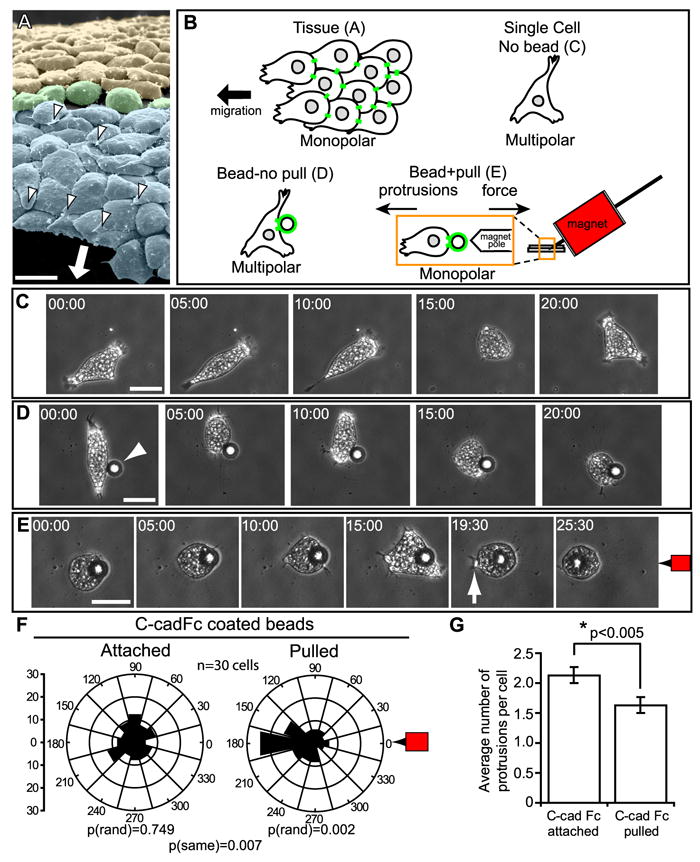
(A) SEM of mesendoderm (blue shading) from dorsal region of Xenopus gastrula with overlying blastocoel roof and attached FN matrix removed reveals basal surfaces of the mesendoderm cells with underlapping monopolar lamelliform protrusions (white arrowheads) oriented in the direction of travel (arrow). A transitional group of non-polar cells (green shading) separates mesendoderm and mediolaterally intercalating mesoderm (yellow shading). Note that the long axis of each mesendoderm cell (i.e., in direction of travel) is oriented perpendicular to that of the mediolaterally intercalating mesoderm cells. (B) Schematic of experimental strategy for magnetic bead pull assay (see Experimental Procedures for details). (C) Still images from timelapse movie (Movie S1) of a single multipolar mesendoderm cell plated on FN. (D) Still images from timelapse movie (Movie S2) of an isolated mesendoderm cell, plated on FN and with C-cadFc coated bead attached (arrowhead). (E) Still images from timelapse movie (Movie S2). Same cell as (D), C-cadFc bead pulled by magnet indicated at right (red magnet icon). A lamellipodium forms (arrow) opposite the direction of bead pull and results in directed cell migration. (F) Quantitation of protrusion angles relative to cell centroid (center of rose diagram) and magnet at right (0°). Y-axis for rose diagram represents percent of total protrusions. (G) Quantitation of protrusions per cell after bead attachment and pull. Data are represented as mean ± SEM. All scale bars, 50μm. (C-E) Times shown in minutes:seconds. See also Figures S1, S2, and Movies S1-S3.