
Figure 4. Recruitment of PG to Stressed Cadherin Adhesions.
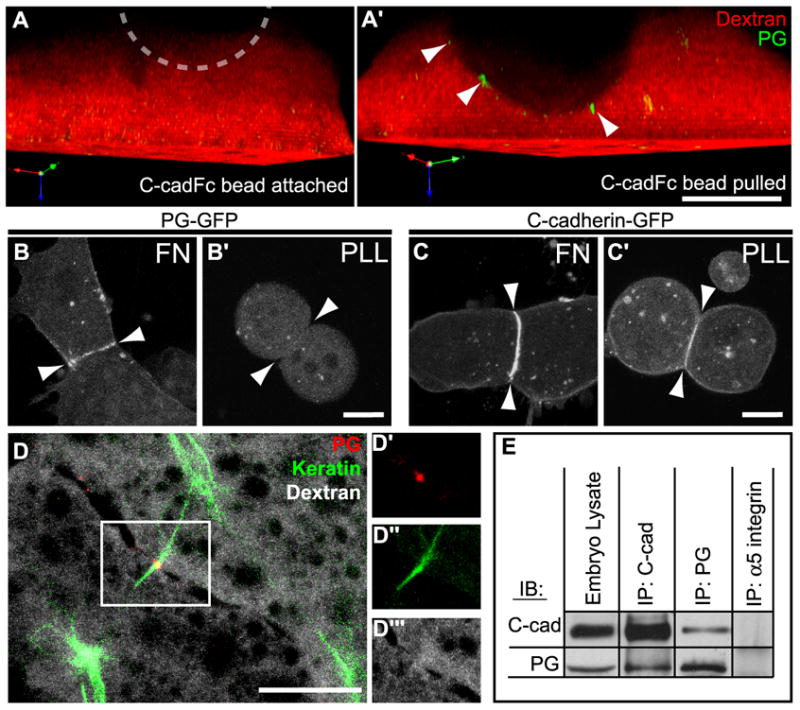
(A, A’) 3D rendered side view of a normal cell injected with Alexa555-dextran (red) and expressing PG-GFP (green) before (A) and after (A’) C-cadFc bead pull. Location of bead, dashed circle. Cells expressing either PG-GFP (B,B’) or C-cadherin-GFP (C,C’), plated on either FN (B,C) or PLL (B’,C’) and allowed to form cohesive pairs. Arrowheads indicate plane of cell-cell boundaries. (D) Mesendoderm cells in live tissue expressing PG-GFP (red), mCherry-XCK1(8) (green), and labeled with Alexa647-dextran (gray). Image is a collapsed 2μm Z-stack of the posterior-lateral region of two adjacent cells in a mesendoderm explant. Outlined region in (D) is shown in independent color channels of plakoglobin-GFP (D’), mCherry-XCK1(8) (D”), and dextran (D’”). (E) C-cadherin and PG were immunoprecipitated from whole embryo extracts and immunoblotted as indicated. α5 integrin immunoprecipitates served as negative controls. All scale bars, 15μm.