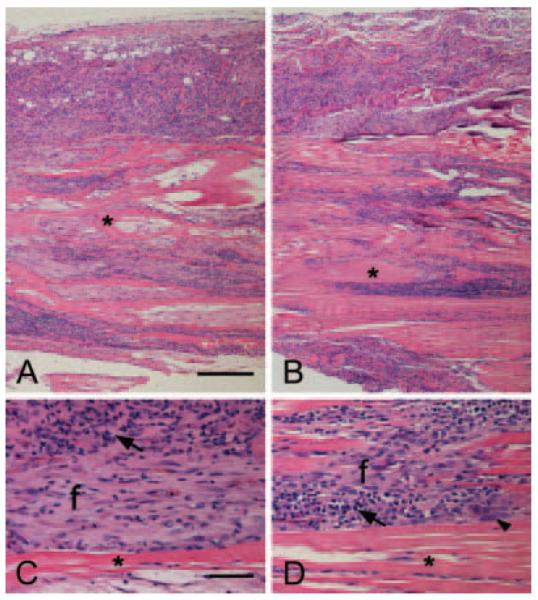
Figure 6.
Histology, Day 28. Representative H&E stained sections of fascia xenograft from the abdominal wall (A,C) and shoulder (B,D). (A,B) Scale bar = 200 μm (×100); (C,D) scale = bar = 50 μm (×400); original fascia matrix (asterisks), fibroblast-like cells (f), lymphocytes (arrows), multinucleated giant cells (arrowhead).

